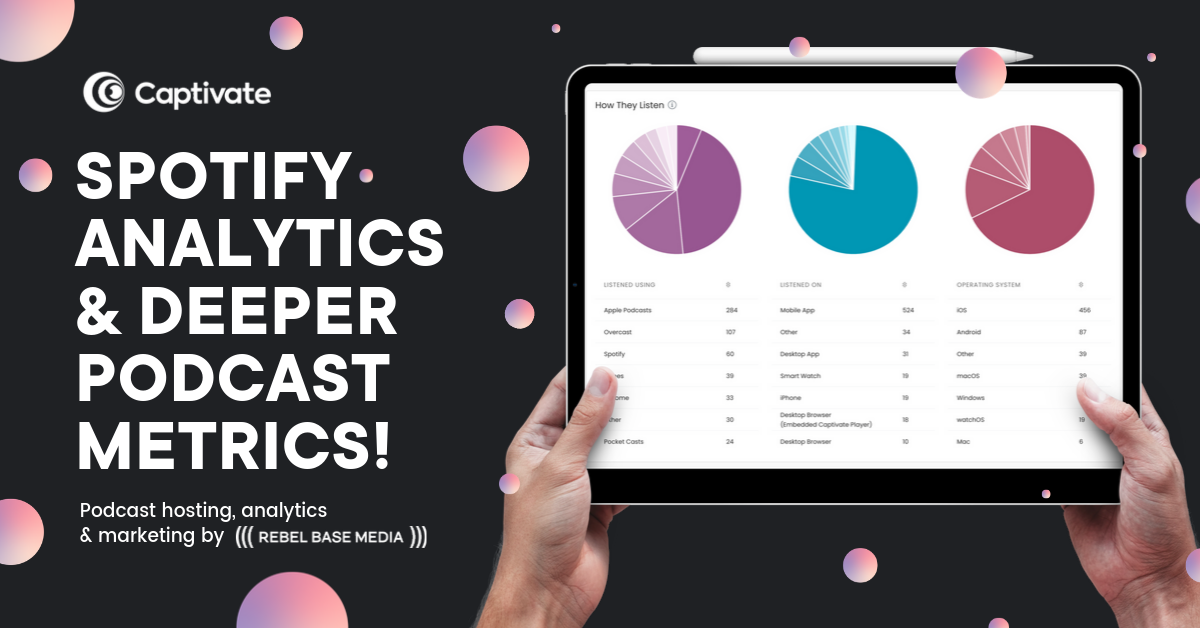

Reading Time: 2 minutesWith a new episode deep-dive view, publish date overlays and city/region breakdowns across your entire show or on an episode-by-episode basis, your Captivate podcast analytics just got a serious power boost!
Pierre, one of our resident Captivate engineers, an all-round nice guy and owner of the biggest hair in lockdown has been working exceptionally hard with the engineering team on crafting some sweet podcast analytics upgrades for Captivate podcasters that we’ve released today!
Here’s a quick rundown of what the team has done:
- Deep-dive episode view: You can now dive-deep into the trends for each podcast episode that you release by filtering your entire analytics data on an episode-by-episode basis. Ooooof!
- Overlay download data with release days: What happens when you release an episode? BOOM! Downloads! Right? Well, usually yeah but sometimes peaks and troughs occur where you absolutely would not expect them. So, click the new shiny little box to overlay your podcast release dates on to your podcast download data to start to learn about some of the trends that your show experiences. Pro tip: try “singe day” view with this turned on and choose a date when you published something.
- Break your download data down into state, region, city/town level: Available at show or individual episode level, you can now view the states/regions and city/town that your show gets downloaded in. Cool, right?
- Add percentages to all the data you’d like to see as a percentage: Data geek? Just like the shape of a percentage sign? We’ve added percentages to every reasonable piece of data that you’d want to see a percentage next to. You’ll see percentages in grey next to the core data where available. If you do just like the shape of a percentage sign, here’s a little something for you: %%%%%%%%%%.